Case Study:
Page Speed Optimization
Improved performance by restructuring rendering, reducing client-side work, and leveraging caching—driving consistent gains across key page types.
Context
I was looking to improve the performance of a direct booking SaaS platform - specifically the listing and details pages, which were critical for user acquisition and conversion. These pages had gradually become slower over time, and I wanted to understand why and how to fix it.
The platform runs on a multi-tenant Next.js setup where each host gets a customized landing page. Over time, as more features were added to support flexible layouts, integrations, and richer content, the pages started getting heavier—especially on mobile.
There wasn’t a single breaking change that caused this. It was more of a slow build-up: a few extra client-side fetches here, slightly larger images there, a couple of third-party scripts added over time. Individually, none of these felt like a big deal. Together, they started to add up.
Eventually, it reached a point where performance issues became visible outside engineering. Pages felt slow to load, interactions lagged, and Core Web Vitals dropped. This started affecting bounce rates on paid traffic, SEO rankings, and overall conversion on listing pages.
I picked this up as a focused effort to understand where the load time was actually going and how much of that work was avoidable.
Key Finding:
The pages worked, but they were doing too much work on the client, too early in the lifecycle.
- Large un-optimized images (especially hero + galleries) were dominating load time
- Too many scripts were loading upfront instead of progressively
- A lot of data fetching was happening on the client via
useEffect - Third-party scripts were competing for main thread time
- There was no clear performance budget or guardrails
Approach
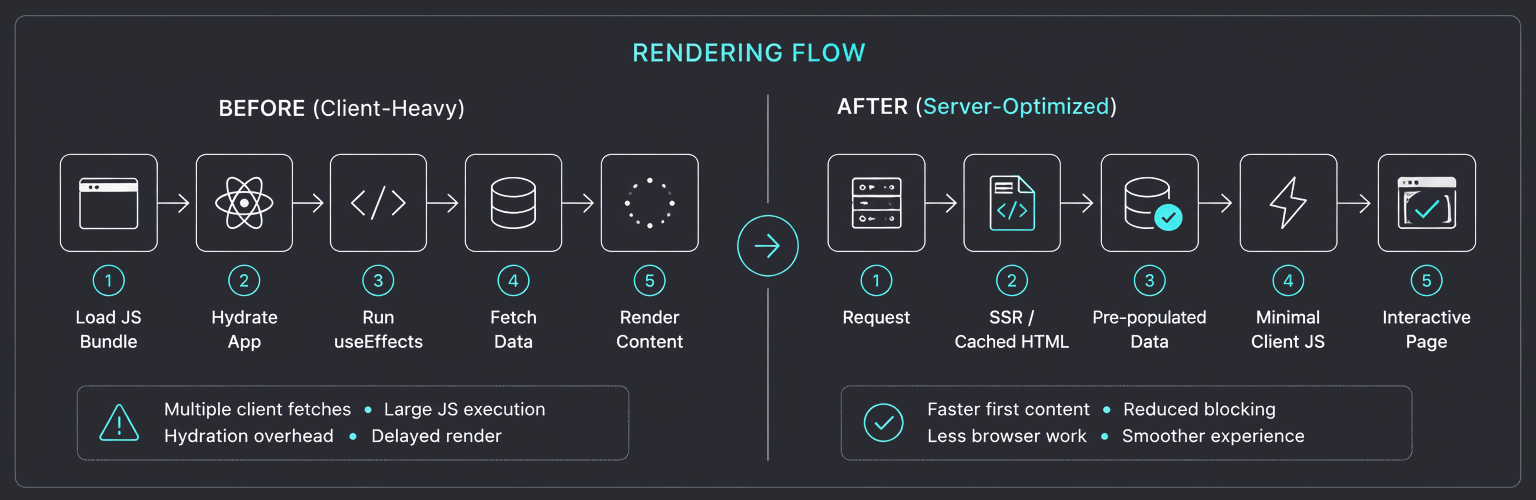
A big early realization was around caching and rendering. A lot of the pages were effectively being rebuilt for every user, even though most of the underlying data didn’t change that often. At the same time, we were relying heavily on client-side fetches, which meant the browser was doing a lot of work after the page had already started loading.
The direction from there was fairly straightforward: move predictable work earlier (server-side or cached), and reduce how much the browser has to figure out at runtime.
Planned Optimization Strategy:
Steps Taken
[1] Shift data fetching server-side
Replaced repeated client-side fetches with SSR where possible, and cleaned up duplicate calls (like shared host/settings data being fetched multiple times). This reduced main-thread work, but also meant being careful about not slowing down the initial render too much.
[2] Get images under control
A lot of LCP issues were just large assets. Resizing, switching to WebP, and making sure only the important images load first had a noticeable impact pretty quickly.
- Converted assets to WebP
- Proper sizing (no more 3000px images in 400px containers)
- Introduced responsive image loading
- Lazy-loaded below-the-fold content
- Optimized hero image loading priority
[3] Trim down JavaScript
Looked at what was actually needed on the client vs what was just there by default. Removed unused imports, split bundles, and deferred anything that didn’t need to run immediately.
- Deferred non-critical JS
- Removed unused libraries
- Split bundles (code splitting)
- Optimized font loading (no layout jumps)
[4] Clean up network noise
Removed redundant API calls and delayed third-party scripts so they weren’t competing with core page rendering.
- Delayed analytics + trackers
- Loaded scripts after interaction where possible
- Removed redundant integrations
[5] Layout stability (CLS fixes)
- Reserved space for images/components
- Avoided dynamic content shifts
- Fixed font loading jumps
Summary:
There wasn’t a single “fix”—it was more about gradually reducing unnecessary work and rebalancing where things happen. Along the way, there were some tradeoffs (especially between faster paint vs less JS execution), so it ended up being a bit iterative rather than one clean pass.
Results
Key Takeaways
Most of the gains didn’t come from anything exotic — they came from stepping back and questioning what actually needed to happen on the client.
- Images were doing more damage than expected. Large, unoptimized images were quietly dominating load times. Fixing sizing and delivery gave immediate, noticeable improvements without touching core logic.
- Client-side work had crept in over time. A lot of data fetching and logic had slowly moved into the browser. Pulling that back to the server reduced blocking time and made the app feel faster, even when raw load times didn’t change dramatically.
- Caching wasn’t being fully leveraged. The system was recomputing things more often than necessary. Introducing better caching (especially for HTML) reduced repeat work and stabilized performance across users.
- Simplifying the system had compounding effects. Removing redundant calls and unnecessary code didn’t just improve performance — it made the system easier to reason about, which made further improvements faster and safer.
Results Deep-Dive and Technical Walkthrough
[P1] — Landing Page
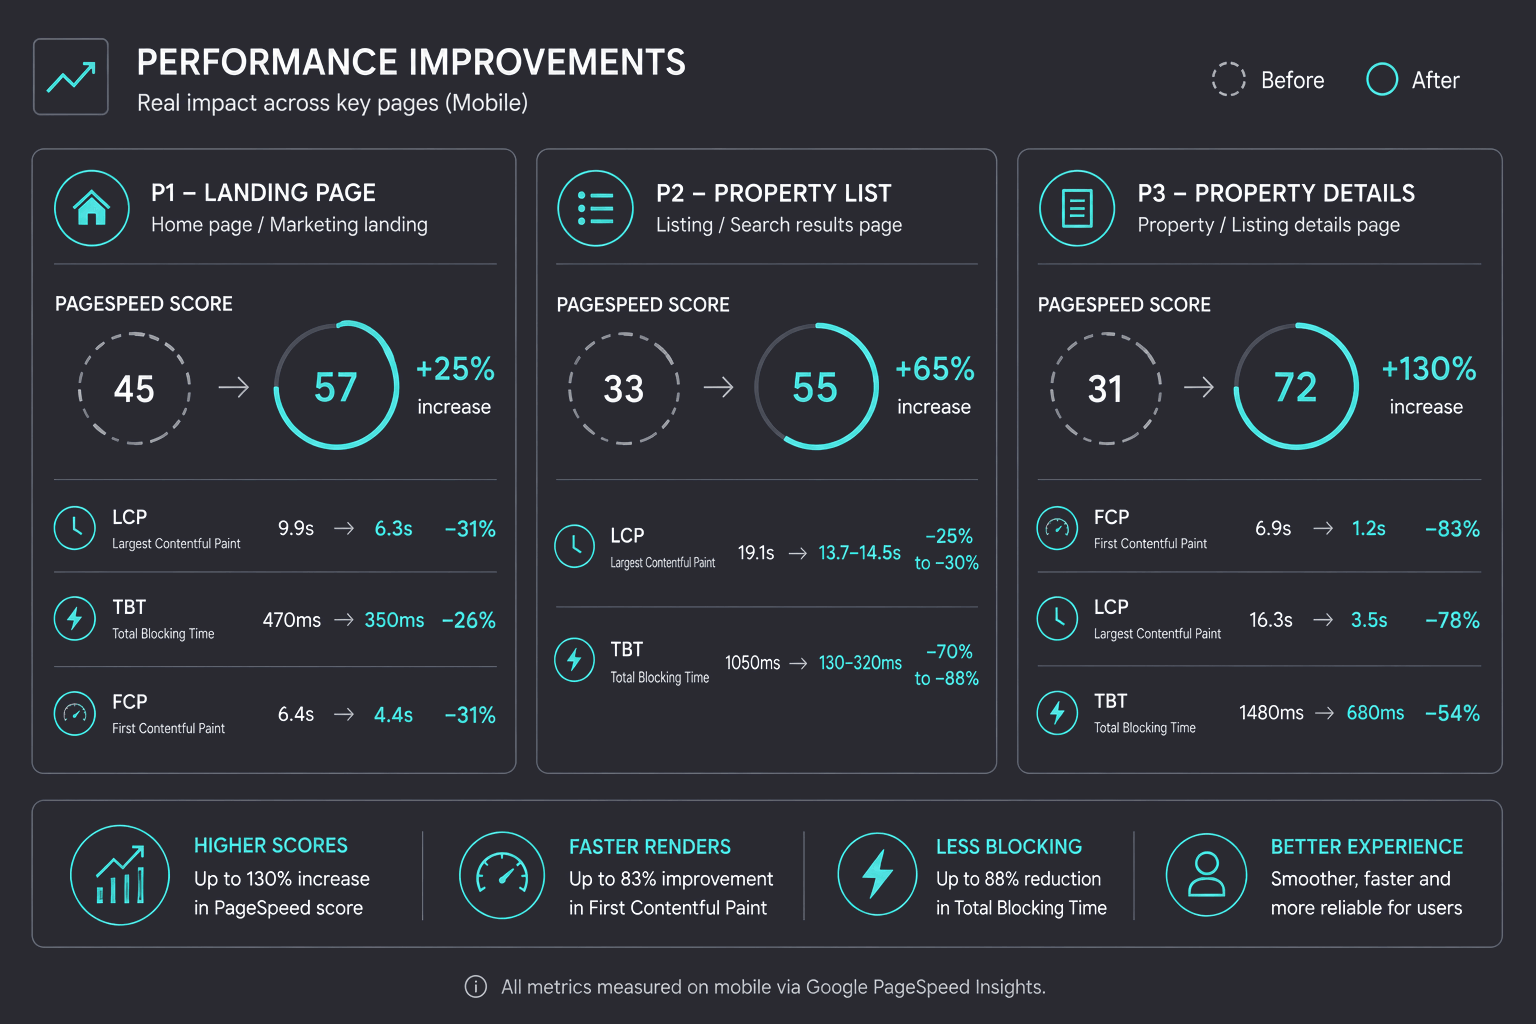
Improved mobile performance from 45 → 57 by removing redundant calls, optimizing images, shifting work server-side, and reducing JS bundle cost.
Baseline
Score: 45
Issues: heavy client-side work, unoptimized images, redundant calls.

Step 1:
Remove Redundant Calls + Image Optimization
- Eliminated duplicate API calls
- Introduced optimized image handling
- Immediate improvement in load behavior
Score: 50

Step 2: Reduce Client-Side Work
- Moved more logic server-side
- Identified remaining client calls: location (IP-based) and search (featured listings—constrained by legacy flags)


Step 3: Post-Optimization State
- Majority of unnecessary client-side execution removed
- Only essential runtime calls remain

Step 4: Framework Upgrade (Next.js 15)
- Improved FCP and LCP
- Introduced regression in TBT (Total Blocking Time) due to JS execution cost

Final State
Score: 57

[P2] Property List Page
Reduced main-thread blocking from ~1050ms → ~130–320ms and improved LCP from 19.1s → ~13.7–14.5s by moving data fetching server-side and balancing SSR with client execution.
Critical issue — extremely high LCP driven by heavy assets + blocking scripts.
Baseline (Production)
FCP: 5.1s | LCP: 19.1s | TBT: 1050ms | CLS: 0.038 | SI: 15.0s

Baseline (Dev — Cached via CDN)
FCP: 4.4s | LCP: 13.6s | TBT: 740ms | CLS: 0 | SI: 7.4s
CDN impact visible — caching improves load but core inefficiencies remain.

Move Fetch Calls Server-Side
FCP: 6.3s | LCP: 14.5s | TBT: 130ms | CLS: 0.054 | SI: 8.8s
Major TBT drop — shifting work server-side reduces main-thread blocking, but delays first paint.

Pre-populate Data + Hybrid Rendering
FCP: 5.3s | LCP: 13.7s | TBT: 320ms | CLS: 0 | SI: 6.8s
Balanced state — better paint timings with acceptable JS cost; highlights tradeoff between FCP and TBT.

[P3] Property Details Page Optimization
Incremental improvements compounded from 31 → 72 through caching, LCP fixes, and system-level optimizations.
Baseline
Performance: 31 | Accessibility: 86 | FCP: 6.9s | LCP: 16.3s | TBT: 1480ms | CLS: 0.002 | SI: 9.3s
High TBT dominates — main-thread blocking is the primary bottleneck despite decent CLS.

With Cache Enabled (31 → 41)
Caching alone gives a modest bump (31 → 41) by reducing repeat computation, but core bottlenecks remain.

LCP Optimization + Cache (41 → 66)
Focused on image optimization, render path improvements, and deferring non-critical JS. This drove a significant boost to 66 by addressing the most egregious LCP blockers and reducing main-thread work.
LCP-focused fixes push performance to ~45 — initial gains from prioritizing above-the-fold content.
Continued iteration (~51) — incremental improvements by refining render path and asset loading.
Compounding gains (~66) — combined effect of caching + rendering + reduced JS execution.

Fall-on Improvements from P1 Optimizations (66 → 72)
Final uplift (~72) driven by upstream improvements — shows how system-level changes cascade across pages.
